
Many marketers rely on Google Analytics (GA) to analyze their web and campaign performance. But what if you could move beyond internal analysis to understand your performance within a broader context?
GA's benchmarking data offers exactly that, enabling you to identify opportunities by revealing how you measure up against your peers.
By comparing your metrics against similar businesses, GA benchmarking can highlight activation opportunities you might otherwise miss, and pinpoint areas ripe for optimization.
In this post we’ll explore benchmarking in GA, including a recent benchmarking update and how you can unlock value and insights with GA’s benchmarking data.
First Things First: What is Benchmarking in Google Analytics?
GA’s benchmarking feature groups your analytics data with similar businesses’ analytics data to create a performance comparison. It has been a part of GA for a long time but was previously limited to normalized data (i.e. percentages and ratios) such as engagement rate or key event rate.
However, with a recent release, Google has added support for 20 additional unnormalized metrics including total revenue, engaged sessions, and new users. This gives marketers stronger visibility into how their website performance compares to similar businesses in absolute terms.
How Does It Work?
Using both normalized and unnormalized metrics, your performance is organized into percentiles (median, 25th, 75th) compared to similar businesses. This is relatively straightforward for normalized metrics because 50% is still 50% whether it’s 250 of 500 or 300,000 of 600,000.
It’s not as easy for unnormalized metrics. So, to benchmark on absolute numbers, GA estimates a performance range based on your property's number of active users. This estimate is created by multiplying the peer group's normalized metric by your property's active user count. For example, imagine your peer group has four sessions per active user. If you multiply that by your 100,000 active users, you get a benchmark estimate of 400,000.
Benchmarking data is protected through encryption and aggregation with strict privacy thresholds ensuring a minimum number of properties, users, and data volume are met. The aggregated, anonymized benchmarking metrics are refreshed every 24 hours.
Enabling & Navigating Benchmarking
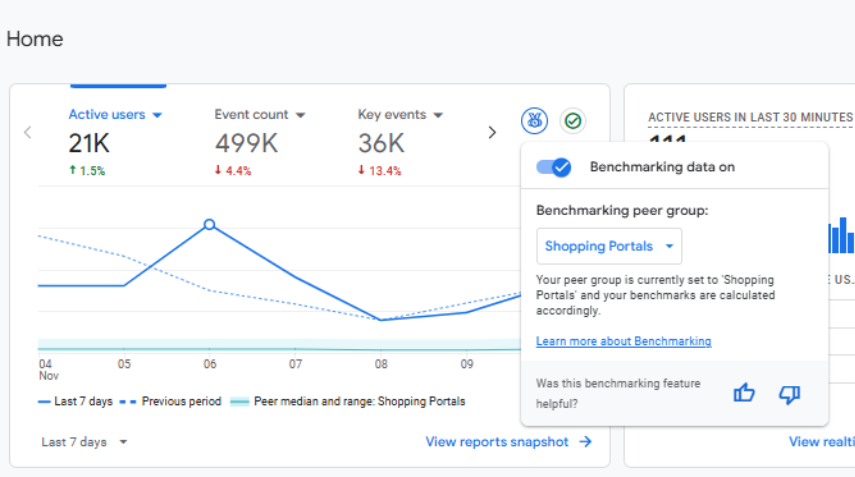
To use GA benchmarking data, your property must first have the “Modeling Contributions & Business Insights” setting enabled in your Account Settings.
From there, you can easily turn benchmarking data on or off by clicking the benchmark badge located in the top right of an overview card. When the feature is active, you will see "On" next to the badge, and the peer comparison will immediately appear in the overview card for available metrics.
Once benchmarking is enabled, you’ll also see the benchmarking badge and available benchmarking options on GA’s “Home” screen:
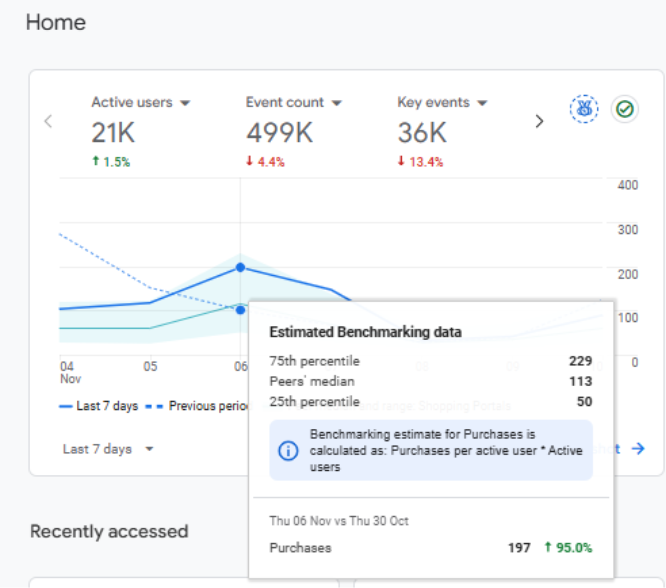
Now you can start exploring your benchmarking data and insights. In the below screenshot you can see this in practice. Using benchmarking data from the Google Store Demo GA account, we can see that the Google Merch site’s purchases are somewhere near the median performance for their peer category for Nov 6, 2025.
Putting Benchmarking Data to Work
There are multiple ways to leverage GA’s benchmarking data for informed decision making and optimization opportunities.
For example, GA’s benchmarking comes in handy when setting KPIs and performance targets. The data can help you make informed KPI goals based on data from related industries without needing to invest in costly independent research.
Benchmarking data can also provide helpful insight into the impact of your website content. For example, if your Engagement Rate is below the 25th percentile, you may need to improve content quality or site experience. Conversely, if your Average Session Duration is above the 75th percentile, your website content is likely highly engaging and a competitive strength.
Regardless of use case, it’s always good to use benchmarking data in conjunction with other competitive insights. Although it’s a helpful data source, its peer group opacity and directional nature mean it is best used alongside other information.
For example, imagine you are an appliance manufacturer and discover that you are losing organic traffic. However, there have been no changes to your tactics that explain the gap, and you know from other competitive research that, broadly, you are losing market share compared to your competitors.
You can use your benchmarking data on user and session related metrics to see your traffic drops in relation to peer group data. Studying this alongside your market research and emergent trends in AI-driven search, you may determine that you need to invest more in LLM-friendly content practices and AI-driven Search to help reclaim that lost share of search.
The Power of GA Data
GA’s benchmarking data offers a handy lens for identifying activation opportunities and optimizing your marketing efforts. However, it's vital to remember that this is just one type of data contained in GA.
Beyond simple comparisons, GA provides crucial insights into user behavior, campaign effectiveness, and overall digital health. Harnessing the full range of GA's insights is crucial for making data-driven decisions that elevate your business and marketing performance.
Check-out our latest content for more ways to tap into the power of your data:
- Guide & Training: How to Maximize AI-Ready Data in Google Analytics
.webp)

.webp)